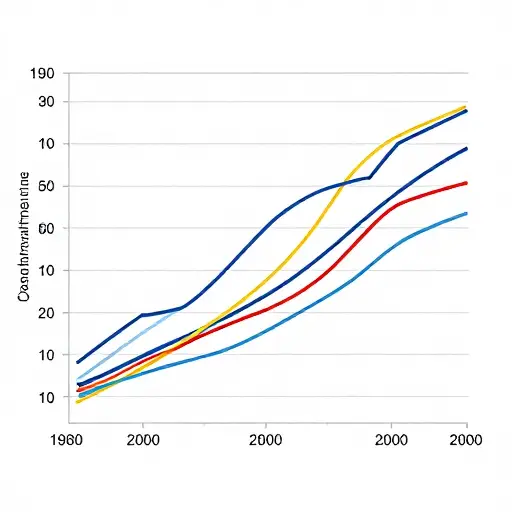
该图表显示了1980年至2000年间一系列来源产生的二氧化碳量。
The graph shows the amount of carbon dioxide produced from a range of sources from 1980 to 2000.
▼点击显示答案
graph英 /ɡrɑːf/|美 /ɡræf/
解释
graph 是名词,来自希腊语 graphos(书写),指用线条或点来表示数据关系的可视化图表,常见的有折线图、柱状图等。
The graph shows the amount of carbon dioxide produced from a range of sources from 1980 to 2000.
graph 是名词,来自希腊语 graphos(书写),指用线条或点来表示数据关系的可视化图表,常见的有折线图、柱状图等。